VxWorks 5.5 Programming Guide: Tornado 2.2 and WindView
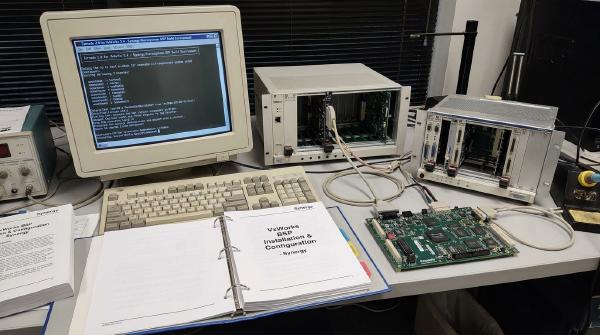
This tutorial provides a practical introduction to VxWorks 5.5 application development using the Tornado 2.2 integrated development environment (IDE). You will create and build a downloadable project, connect to a target system, execute application code, and use WindView to inspect real-time behavior.
The example uses Intel 80486-based target systems referred to as “purpleboxes.” The tutorial also introduces a sample C application that coordinates two tasks through a binary semaphore and introduces timing variation to make scheduling behavior easier to observe.
By completing the exercise, you will learn how to:
- Create and configure a VxWorks downloadable project.
- Build an executable for the target architecture.
- Configure FTP-based image loading and establish a target-server connection.
- Run application functions through the Tornado remote shell.
- Capture, export, and analyze execution traces with WindView.
- Measure execution intervals and examine timing variability.
Compatibility note: This is a historical workflow for VxWorks 5.5 and Tornado 2.2. Its project settings, toolchain names, target-server configuration, and device instructions are specific to that environment. Use the appropriate documentation and hardware procedures for your particular installation.
🛠️ Start a VxWorks Project #
Launch the Tornado 2.2 development environment.

Create a new downloadable project.

Name the project Simple. If you already have a Tornado workspace, you can reuse it. Otherwise, create a workspace on the Z: drive, as required by this exercise. Tornado stores each project in its own directory within the workspace.

Select the target toolchain #
The target systems used in this exercise, known as purpleboxes, are based on Intel 80486 processors. Select the I80486gnu toolchain for development targeting these systems.

Complete the project wizard. If the workspace does not already exist, Tornado creates it as part of the setup process.

🧱 Create and Build the Simple Project #
Copy the supplied simple.c source file into the Simple project directory.
In Tornado’s Files tab, right-click the project and add simple.c to the project configuration.
Next, open the Builds tab. Under Simple Builds, locate the I80486gnu build configuration. Right-click it and rebuild simple.out. When Tornado prompts you to regenerate dependencies, confirm by clicking OK.

During compilation, Tornado displays build messages in the Build Output window. If an error occurs, double-click the corresponding error message to navigate to its source location.

After a successful build, Tornado produces simple.out, the downloadable object module used in the subsequent target-side execution steps.

⚙️ Start the Target System and Target Server #
The purplebox systems used in this exercise obtain a standard VxWorks image from the development station through FTP during startup. Start the required FTP server before powering on the target.

Prepare the target hardware #
Connect power to the AVerKey iMicro video converter used by the setup.
Verify the power connections before switching on any device. The power connectors for the converter and the purplebox may look similar, but the devices require different voltages. Follow the original hardware labeling and approved setup instructions rather than relying on connector appearance.


Power on the purplebox and select the appropriate monitor input using the middle button on the display. You should see the BIOS startup information followed by the VxWorks boot ROM output.
After the boot-ROM timeout, the target attempts to download its VxWorks image from the development station.

Verify target readiness #
On the target monitor, look for the message:
WDB: Ready
This message indicates that the target’s WDB agent has reached its ready state. It is an important indication that the target-side debugging and communication infrastructure is available.
Next, start a Target Server from Tornado. The Target Server acts as an intermediary between the IDE and the target, enabling development tools to communicate with the running VxWorks system.
Select the correct target configuration using the labels associated with the development station and target hardware.

If the target list is empty, the historical setup instructions specify running the registry update file named Tornado22-registry-targets, located in C:\Tornado2.2. This file is specific to the original environment; verify its source and suitability before executing it.
Once the Target Server is running, inspect the bullseye icon in the Windows system tray. An exclamation mark indicates a connection or configuration problem. Double-click the icon to inspect its status.
From Tornado, connect to the configured Target Server. In this exercise, there should be only one applicable target-server connection.

💬 Interact with the Target System #
During development, the Tornado remote shell provides a convenient way to inspect the target and invoke application functions.
Open the shell using its toolbar icon.

The shell provides command-line access to the target’s running VxWorks environment. The Tornado User’s Guide documents the available commands, and entering help displays brief descriptions of supported shell operations.

Download and execute the application #
In Tornado’s Files tab, right-click the Simple Files entry and download simple.out to the target.
After the download succeeds, start the example by invoking its entry function from the target shell:
progStartThe progStart() function creates the binary semaphore and starts the two application tasks.
The shell can also invoke other functions by name, provided that the functions are available to the target shell and their arguments are supplied correctly. This capability is useful for testing, inspecting system state, and controlling sample programs without rebuilding the entire VxWorks image.
📊 Collect System Performance Data with WindView #
WindView is the tracing and performance-analysis tool associated with Tornado. It records target-side events and presents them in a graphical timeline, allowing developers to examine task scheduling, execution intervals, and other real-time behavior.
Launch WindView from the Tornado toolbar.

Configure event-log collection #
WindView stores collected events in buffers on the target. In the Upload Mode screen, select whether data should be uploaded continuously or retained on the target until logging stops.

For this exercise, select Deferred Upload.
Deferred upload reduces the frequency of data transfers during measurement, potentially reducing interference with the workload. However, the finite on-target buffers limit how much trace data can be retained before the buffers fill. Continuous upload has different resource and data-transfer characteristics, so the collection mode should be selected according to the measurement objective.
You can also adjust the number and size of the buffers through Advanced options.
Select events and start logging #
Use the Event Logging Level screen to configure the events to capture.

Open the Log Overview tab and set the refresh interval to 1 second. Press the green Go button to begin logging.

Allow the buffers to accumulate events, or stop recording manually by pressing the red Stop button. When capture finishes, upload the event log using Upload Event Log.

WindView generates an event graph similar to the following example.

Inspect the event graph #
Use the timeline to investigate the relationship between task execution and system events. In particular, examine the following questions:
- What does each event icon represent?
- What do the intervals between events measure?
- How can you zoom into a specific time range?
- Can you filter the graph by event type?
- How can you measure the time between two selected points?
Understanding the event types and timeline scale is essential when interpreting scheduling behavior. A visible delay between two events may reflect task scheduling, semaphore blocking, interrupt handling, or other activity, depending on the trace configuration.
Export trace data #
For quantitative analysis, export the recorded events to CSV.

Important: If the timeline is zoomed in when you export the data, the export may contain only the currently selected or zoomed interval. Reset the view or select the full capture range when you need to analyze the entire experiment.
📈 Analyze the Timing Data #
The sample application provides a useful starting point for studying how execution intervals vary under a real-time scheduler.
After exporting the trace to CSV, identify the events corresponding to successive executions of the simple task or the corresponding semaphore-driven task activity.
Calculate the following statistics:
- Average interval: The arithmetic mean of the time differences between consecutive executions.
- Minimum interval: The smallest observed interval.
- Maximum interval: The largest observed interval.
- Interval distribution: A histogram showing how frequently different execution intervals occur.
For timestamps \(t_1, t_2, \ldots, t_n\), calculate consecutive intervals as:
Δt_i = t_(i+1) - t_iThe mean interval is:
Mean interval = (Σ Δt_i) / (n - 1)The minimum and maximum observed intervals are:
Minimum interval = min(Δt_i)

Maximum interval = max(Δt_i)
A histogram helps reveal whether intervals are tightly clustered around a nominal value or spread across a wider range. Multiple clusters may indicate distinct execution paths or scheduling conditions, while sporadic outliers may warrant investigation of interrupt activity, contention, or other sources of execution delay.
Interpret these statistics carefully. A minimum-to-maximum range describes the observed sample, not a proven worst-case execution-time bound. Likewise, an average interval close to the expected period does not guarantee that every execution meets its deadline.
For more reliable conclusions, collect representative traces under different operating conditions, keep the event-logging configuration consistent between measurements, and account for the measurement overhead introduced by tracing.
💻 Source Code: simple.c
#
The following program demonstrates basic VxWorks task management, binary semaphore synchronization, periodic delays, and a staged shutdown mechanism.
The gatekeeper() task releases a semaphore and waits for a variable delay. The simple() task blocks on that semaphore and increments an execution counter whenever it receives a signal. The progStop() function initiates shutdown, waits for the tasks to finish, releases the semaphore resource, and reports the final count.
/*
 * simple.c - A sample program introducing VxWorks and Tornado.
 *
 * The gatekeeper task periodically releases a binary semaphore.
 * The simple task waits for the semaphore and counts each release.
 */

#include "vxWorks.h"
#include "stdio.h"
#include "stdlib.h"
#include "semLib.h"
#include "taskLib.h"

#define DELAY_TICKS 50
#define STACK_SIZE  20000

/*
 * Run states support an orderly shutdown and help prevent
 * tasks from accessing the semaphore after it is deleted.
 */
#define ALL_GO             0
#define SHUTDOWN           1
#define GATEKEEPER_STOP    2
#define ALL_STOP           3

/* Global state */
int tidGatekeeper;
int tidSimple;
int runState;               /* Current state of the application */
int count;                  /* Number of simple-task executions */

SEM_ID syncSemId;           /* Synchronizes gatekeeper and simple */

/* Forward declarations */
void gatekeeper(void);
void simple(void);
void progStop(void);

/*
 * progStart - Start the sample program.
 *
 * RETURNS: OK
 */
STATUS progStart(void)
{
    syncSemId = semBCreate(SEM_Q_FIFO, SEM_EMPTY);

    if (syncSemId == NULL)
    {
        return ERROR;
    }

    /* Initialize the application state. */
    runState = ALL_GO;

    tidGatekeeper = taskSpawn(
        "tGateKeeper",
        200,
        0,
        STACK_SIZE,
        (FUNCPTR)gatekeeper,
        0, 0, 0, 0, 0, 0, 0, 0, 0, 0
    );

    if (tidGatekeeper == ERROR)
    {
        semDelete(syncSemId);
        return ERROR;
    }

    tidSimple = taskSpawn(
        "tSimple",
        220,
        0,
        STACK_SIZE,
        (FUNCPTR)simple,
        0, 0, 0, 0, 0, 0, 0, 0, 0, 0
    );

    if (tidSimple == ERROR)
    {
        /*
         * Stop the gatekeeper and wake it from its delay.
         * The gatekeeper will publish the stopped state.
         */
        runState = SHUTDOWN;
        taskDelete(tidGatekeeper);
        semDelete(syncSemId);
        return ERROR;
    }

    return OK;
}

/*
 * gatekeeper - Release the semaphore consumed by the simple task.
 */
void gatekeeper(void)
{
    while (runState == ALL_GO)
    {
        semGive(syncSemId);

        taskDelay(DELAY_TICKS + (rand() & 0x0f) - 8);
    }

    runState = GATEKEEPER_STOP;

    /* Wake the simple task so that it can finish its loop. */
    semGive(syncSemId);
}

/*
 * simple - Wait for semaphore signals and count executions.
 */
void simple(void)
{
    count = 0;

    while (runState != GATEKEEPER_STOP)
    {
        if (semTake(syncSemId, WAIT_FOREVER) == OK)
        {
            count++;
        }
    }

    runState = ALL_STOP;
}

/*
 * progStop - Initiate shutdown and report the final count.
 *
 * Call this routine to stop the sample program.
 */
void progStop(void)
{
    runState = SHUTDOWN;

    /* Wait for both tasks to finish their shutdown sequence. */
    while (runState != ALL_STOP)
    {
        taskDelay(1);
    }

    /* Release the semaphore resource. */
    semDelete(syncSemId);

    printf("Simple executed %d times.\n", count);
}
Understand the task and semaphore behavior #
The program illustrates several fundamental VxWorks concepts.
Task creation: taskSpawn() creates the tGateKeeper and tSimple tasks with different priority values. In the VxWorks priority convention used here, a numerically smaller priority value represents a higher priority. The gatekeeper therefore has higher priority than the simple task.
Binary semaphore synchronization: semBCreate(SEM_Q_FIFO, SEM_EMPTY) creates a binary semaphore initially unavailable. The gatekeeper calls semGive() to signal that an execution is permitted, while the simple task calls semTake() to wait for the signal.
Variable execution intervals: taskDelay() suspends the gatekeeper for a delay based on DELAY_TICKS with a small random adjustment. This introduces interval variation that can be examined through WindView.
Execution counting: The count variable records how many semaphore signals the simple task processes. When the application shuts down, progStop() prints the final count.
Staged shutdown: The run-state variables coordinate the termination of the tasks. The gatekeeper signals that it has stopped and releases the semaphore so that the simple task can leave its wait state.
Code note: The source retains the legacy VxWorks 5.5 API and task-priority conventions. The added semaphore and task-creation checks provide basic error handling, but this example is intended for a controlled exercise rather than production use. A production implementation should use a more robust lifecycle protocol, handle partial startup and shutdown failures comprehensively, and protect shared state against concurrent access where required. In particular, the simplified shutdown sequence assumes that the tasks have started and that the gatekeeper can complete its delay and signal the simple task.
✅ Conclusion #
This VxWorks 5.5 exercise demonstrates the core workflow for developing and analyzing embedded applications with Tornado 2.2. It covers project creation, target-specific builds, target-server connectivity, remote-shell execution, and WindView trace collection.
The semaphore-driven sample application provides a simple workload for investigating task scheduling and timing variability. By exporting event data and calculating average, minimum, and maximum execution intervals, you can move beyond visual inspection and begin quantifying real-time behavior.
The key lesson is that real-time performance analysis requires both suitable instrumentation and careful interpretation. WindView reveals the sequence and timing of events, while statistical analysis helps identify variation that may not be apparent from the average alone. Together, these techniques provide a foundation for understanding scheduling behavior and investigating timing problems in embedded systems.